Remember the early 2022 bidding wars? A house went on the market, and the buyer who won it paid more than the original asking price. It is easy to wonder how those winners did once they sold, and hard to know without counting.
So we counted. We took closed single family house and townhome sales across the 12-county DFW area from January 1 through July 31, 2022, 41,795 of them, and looked for a later closed sale of the same home. In this post, the buyers who paid more than the original asking price are the winners, and everyone else in the group is the comparison group.
Of the winners who have sold again, 44.7 percent sold for less than they paid. One limit belongs in the first paragraphs, not the notes. Only about 1 in 7 winners has sold so far, so this describes the winners we can see, not every buyer.
Two more limits sit beside that one. We cannot see mortgages or renovations, so every comparison here is between two sale prices and nothing else. And we cannot see sales that never went through the MLS, so our resale counts are a floor.
Key Takeaways
- In early 2022, about two in three DFW home sales closed over the original asking price.
- Of the winners who have sold again, 44.7 percent sold for less than they paid.
- Buyers who paid the asking price or less did that less often, at 28.9 percent.
- More than half of the winners who held over two years before selling still got back less than they paid.
- The City of Dallas share is about half the regional share.
- Most winners show no resale in our data, so this is a count of the winners who sold, not a verdict on everyone who won.
What We Counted, and What Counts as a Winner
Five definitions carry this entire post, so they go first.
The original list price is the first price a home was listed at, the price in the initial agreement between the seller and the seller's broker. We use the original list price recorded for that listing record. Over asking means the home closed for more than that price. The buyers who paid it are the winners, and the buyers who paid the asking price or less are the comparison group.
A resale is a later closed sale of the same home. We looked for it at the same address, matching on street number, street name, street direction and suffix, and ZIP code, and we required the unit number to agree. A later sale at a different unit of the same address does not count. We could not match on parcel IDs, the numbers a tax assessor assigns to a piece of real property for identification and record-keeping, because they are not in our data before September 2023.
Sold for less than they paid means the resale price is lower than that buyer's 2022 purchase price. It is a plain comparison of two closing prices, with nothing adjusted for inflation, repairs or fees.
The window is January 1 through July 31, 2022, in the 12-county DFW area: Dallas, Tarrant, Collin, Denton, Rockwall, Kaufman, Ellis, Johnson, Parker, Hunt, Wise and Hood counties. We kept single family houses and townhomes, and we left out builder sales, sales without a usable original list price and sales with a closing price far outside it. The MLS (multiple listing service) is the shared database agents use to list homes and record sales. We used sales closed through September 30, 2026.
The City of Dallas is the same data restricted to homes with Dallas as the MLS city. We stop at the City of Dallas and the region, and we say why in the section on Dallas below.
Paying Over Asking Was How Most Homes Sold in Early 2022
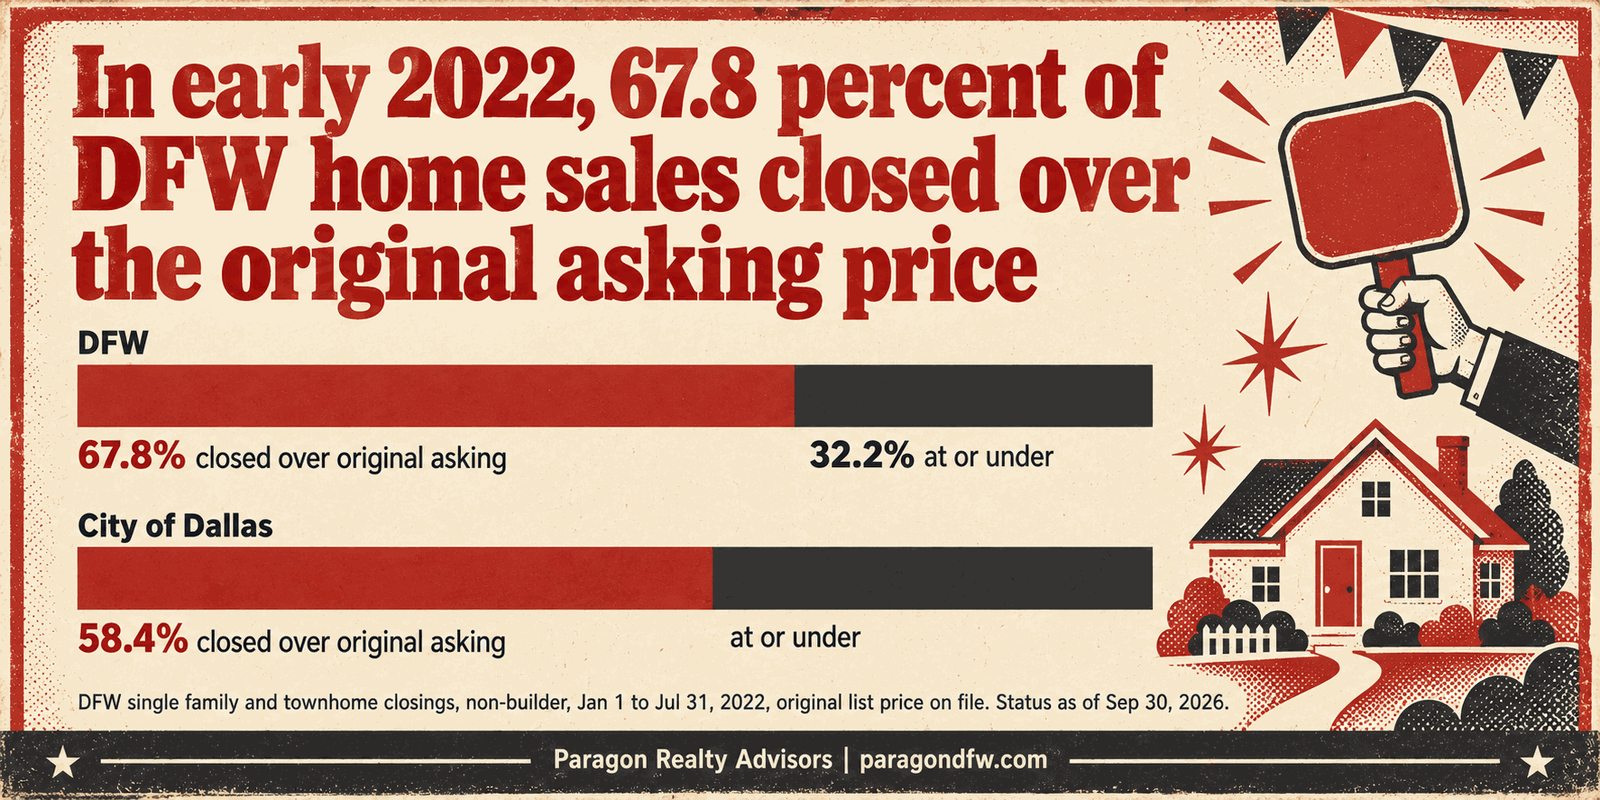
In the first seven months of 2022, 67.8 percent of DFW home sales closed over the original asking price, about two in three. In the City of Dallas the share was lower, 58.4 percent.
Going well over was common too. Of all sales in the window, 43.4 percent closed 5 percent or more over the original asking price.
So the winners were not a fringe group. They were most of the sales in our sample, 28,324 buyers, against 13,471 who paid the asking price or less. The question is how that large group did when it sold.
Winners Who Resold Sold for Less Than They Paid More Often
Buyers who paid the asking price or less did better. Of those who have sold again, 28.9 percent sold for less than they paid, against 44.7 percent of the winners.
That is a gap of 15.8 points. The table near the end of the post lines up the two groups, with the counts behind each rate.
Going well over looks somewhat worse. Of the buyers who paid 5 percent or more over the original asking price, 48.3 percent of their resales came in below the purchase price.
Remember who this describes. The 4,019 winners who resold are 14.2 percent of all winners. The other winners show no resale in our data, and we do not know how they are doing.
More Than Half of the Winners Who Held Over Two Years Still Sold for Less
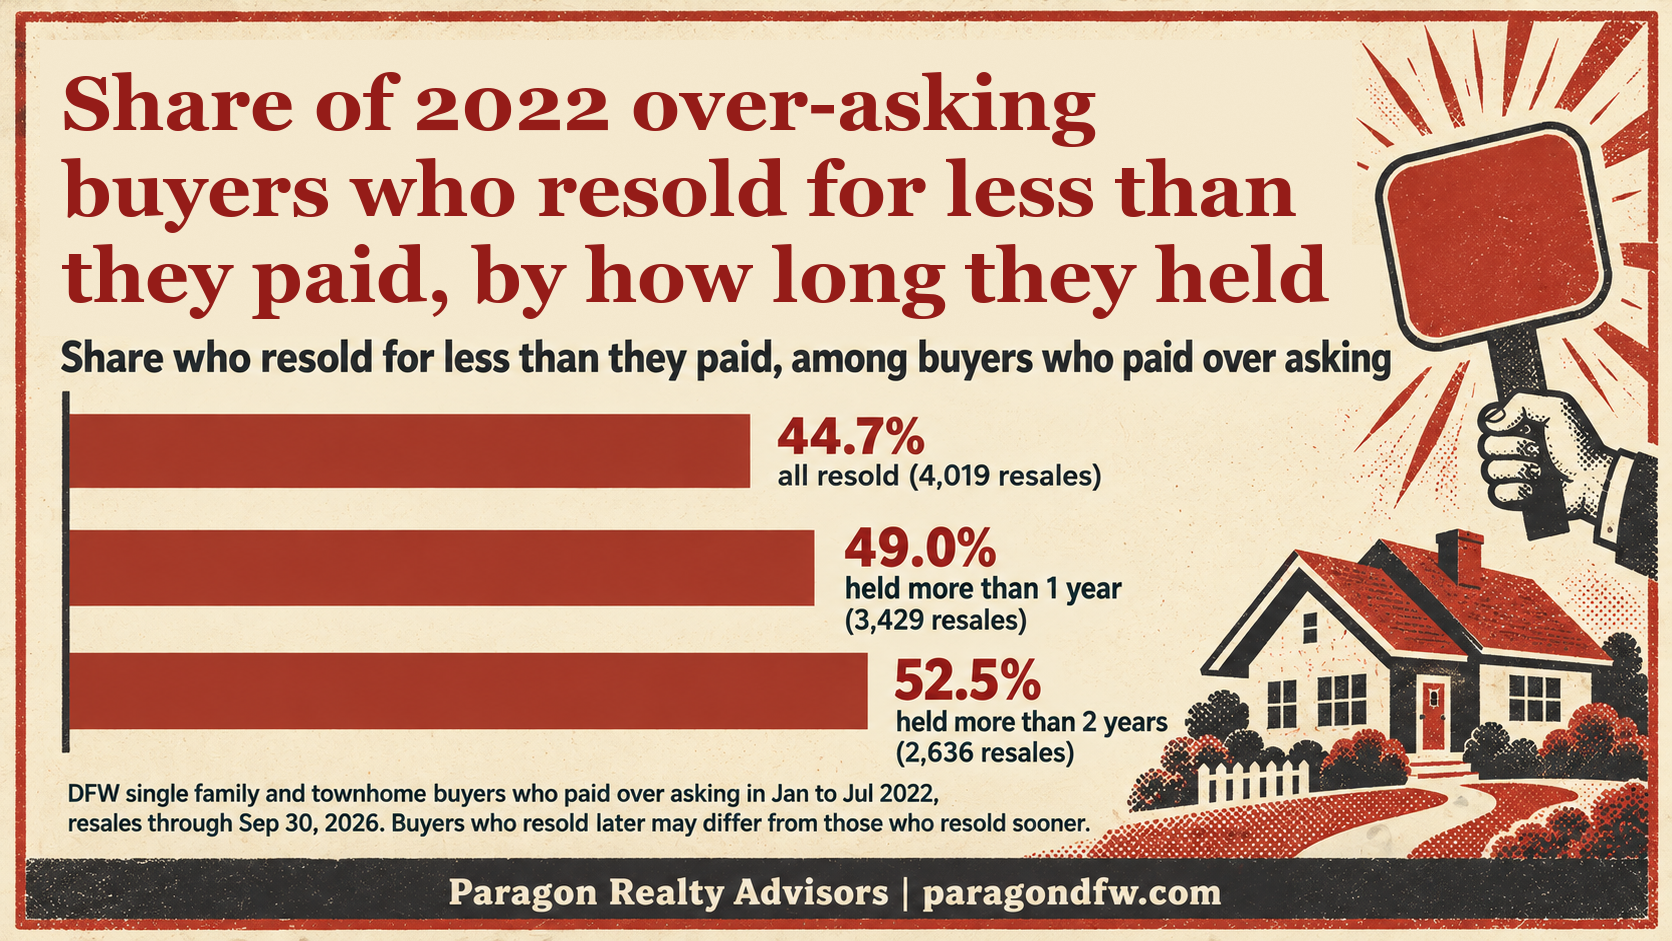
Time did not bail them out. Of the winners who held more than two years before selling, 52.5 percent still got back less than they paid.
The chart shows the share at each holding time, and across all three groups it sits between 44.7 and 52.5 percent. This shows who resold when. It does not show what happens to a homeowner who stays.
The holding groups overlap, so a winner who held three years appears in both of the longer bars. We did not measure why anyone sold, and buyers who resold later may differ from those who resold sooner.
The typical winner who resold held for 2.6 years. The typical winner with no recorded resale has held for more than four years so far.
Selling Costs Would Push the Share Higher
A resale price that beats the purchase price on paper can still leave the seller short. Agent commissions, closing costs and repairs agreed to in negotiation commonly add up to several percent of the price.
We do not know the real costs of any one sale, so we tested two round assumptions, 6 percent and 8 percent of the sale price. At 6 percent, 67.0 percent of the winners' resales fall short of the purchase price. At 8 percent, 72.3 percent do.
These are scenarios, not measurements. We subtracted the assumed costs from each resale price and compared what was left with the original purchase price. The results for the comparison group are in the table near the end.
The City of Dallas Had About Half the Regional Share
In the City of Dallas, 23.1 percent of the winners' resales closed below the purchase price, about half the regional rate. Dallas buyers who paid the asking price or less did better still, at 15.7 percent.
The pattern ran the same direction as in the region: winners who resold sold for less than they paid more often than the comparison group, only at a lower level. The counts for Dallas are in the second table near the end.
We stop at the City of Dallas and the region. A smaller area is a lot of different streets, and a neighborhood-level number can mislead the owner of one home. If you want the read for your own street, we can pull it.
An Earlier Dallas Downturn Was Shallow and Slow
Dallas has had a downturn before, and it looked quite different. The S&P Case-Shiller index for Dallas fell roughly 9.5 percent over four years, from April 2007 to May 2011. The index passed its 2007 peak again in May 2013.
That was slow, shallow and spread over years. An owner who did not have to sell had room to wait. That does not conflict with what we found. Even among the 2022 winners who held more than two years before reselling, more than half sold for less than they paid.
A recovering market does not guarantee a good result on one purchase price. The index describes the broader Dallas market, not the outcome for any one home. What happened after 2022 is not the same episode, and we are not predicting how it ends. The index values are in the third table near the end.
What We Could Not Count Limits These Numbers
It could be who sold. Most of these buyers have not resold. People who sell within a few years are not a random sample. Some may have sold because a job moved them, some because they had to, and some because they got a good offer. If the buyers who stayed fare better or worse than those who sold, this post cannot say. We call this self-selection, and it is the biggest limit here.
It could be mortgages. We cannot see them. The analysis uses the MLS buyer-financing field, which records how a purchase was financed but not the loan amount, the rate, the down payment or any current balance. About 1 buyer in 4 paid cash. So this post makes no claim about whether anyone owes more than their home is worth. It speaks only to what a home sold for compared with what it sold for last time.
It could be renovations. We cannot see a new kitchen, a pool or a roof. A home that sold for more or less than last time may be a different house.
It could be resales we cannot see. Our match is on address in the MLS. A home sold off-MLS, such as a private sale between family or an investor purchase never listed, does not appear. So the resale counts are a floor, not a total.
It could be the match. We match on street address and unit. A renumbered address, a typo or an inconsistent unit entry could miss or mismatch some homes.
It could be a different group of homes. Homes that sold over asking in 2022 were not randomly chosen. They may be in different places, price ranges and ages than homes that sold at or under asking.
It could be a short window. We cover seven months. A different seven months could look different. If you are buying and plan to hold for a decade, the resale record in a short window matters less than the monthly cost, the neighborhood and the condition of the house.
What holds up: the winners who resold sold for less than they paid more often than the comparison group, at every holding time we measured, and in both the full region and the City of Dallas. We call that a real pattern. We do not know all of the causes.
The Full Count, for Reference
This table lines up the winners and the buyers who paid the asking price or less, so you can find every count and rate side by side. The assumed-cost rows are scenarios, not measurements.
Group (DFW, Jan to Jul 2022 buyers) | Over asking | At or under asking |
|---|---|---|
Buyers in group | 28,324 | 13,471 |
Resold | 4,019 (14.2 percent) | 2,253 (16.7 percent) |
Resales below purchase price | 44.7 percent | 28.9 percent |
Held over 1 year, below purchase price | 49.0 percent (3,429) | 32.9 percent (1,762) |
Held over 2 years, below purchase price | 52.5 percent (2,636) | 37.5 percent (1,286) |
Below purchase price after 6 percent costs (assumed) | 67.0 percent | 47.4 percent |
Below purchase price after 8 percent costs (assumed) | 72.3 percent | 53.6 percent |
Two readings of that table. In a group of 100 resellers, about 45 winners came out below their purchase price, against about 29 in the comparison group. Buyers who paid 5 percent or more over the original asking price have resold at 14.3 percent (2,586 of 18,142).
The same lookup for the City of Dallas, where the window covers 5,498 sales.
City of Dallas | Over asking | At or under asking |
|---|---|---|
Resales | 585 | 484 |
Resales below purchase price | 23.1 percent | 15.7 percent |
Held over 2 years, below purchase price | 28.7 percent (352) | not shown |
Of those 5,498 City of Dallas sales, 58.4 percent closed over the original asking price and 36.0 percent closed 5 percent or more over.
The Dallas index values behind the downturn section, from the S&P Cotality Case-Shiller TX-Dallas Home Price Index (January 2000 = 100).
Month | Index value |
|---|---|
April 2007 (peak) | about 125.7 |
May 2011 (low) | about 113.7 |
December 2012 | about 121.8 |
May 2013 (back above the 2007 peak) | about 126.8 |
And the financing recorded for the winners, from the MLS buyer-financing field. A financing type was recorded for all 28,324, and the three shares total 98.9 percent. An FHA loan is a government-insured mortgage with a small down payment. A VA loan is a mortgage for veterans.
Financing recorded (winners) | Share |
|---|---|
Conventional loan | 65.8 percent |
FHA or VA loan | 8.8 percent |
Cash | 24.3 percent |
The Paragon Angle
Our read is a broker's read, not a data scientist's. We cannot tell you whether winning a bidding war in early 2022 was worth it, because most winners have not sold and the count says nothing about the homes they are living in. What the count does show is a comparison of two prices. The analysis compares the 2022 closing price with a later recorded closing price.
If you are shopping now, the setting is different from early 2022. According to CultureMap Dallas, Redfin ranks the Dallas metro area the No. 8 buyer's market among the 49 largest U.S. metros, and its report describes less competition among buyers. Before you open over asking, look at what similar homes actually sold for compared with their original asking prices. We can pull that for you.
If you bought in early 2022 and have not sold, this count does not describe your home. About 1 in 7 winners has resold, and the typical winner without a resale has held for more than four years. What does describe your home is what similar homes near you have sold for recently, adjusted for upgrades this analysis does not measure. We can pull that comparison too.
Frequently Asked Questions
Did buyers who paid over asking sell for less than they paid?
Many did. Of the winners who have sold again, 44.7 percent sold for less than they paid, against 28.9 percent of the buyers who paid the asking price or less. Of the winners who held more than two years before selling, more than half sold for less.
What share of DFW homes sold over asking in early 2022?
In January through July 2022, 67.8 percent of DFW single family and townhome sales, builder sales excluded, closed over the original asking price. In the City of Dallas the share was 58.4 percent.
Does this mean 2022 buyers owe more than their homes are worth?
No. We cannot see mortgages, and about 24 percent of these buyers paid cash. The figures compare two sale prices of the same home and say nothing about loan balances.
How many of the 2022 winners have sold?
About 1 in 7, or 4,019 of 28,324. The rest show no resale in our data. Sales that happened outside the MLS are not counted, so the true share may be higher.
How did the City of Dallas compare with DFW?
In the City of Dallas, 23.1 percent of the winners' resales sold below the purchase price, against 44.7 percent across DFW. The pattern ran the same direction in both places.
Can this tell me what my own home is worth?
No. These are regional counts of sale prices, and a neighborhood number can mislead the owner of one home. A comparison of similar homes near you, closed recently, is the right tool, and we can pull it.
Conclusion: The Count Describes Sales, Not Every Winner
Of the early 2022 winners who have resold, 44.7 percent sold for less than they paid, against 28.9 percent of buyers who paid the asking price or less. The pattern held at every holding time we measured and in the City of Dallas, at a lower level.
It is still a count of the sales we can see. Most winners show no resale in our data, and nothing here says how they are doing. That makes the useful question a local one for each owner and each buyer: what similar homes near you have sold for, compared with what their buyers paid. A regional share cannot answer it, and we can pull the version for your street.
Talk to Paragon
If you want a real comparison for your own home before you decide to sell, hold or buy, we are glad to pull it.
Email: [email protected]
Phone: (469) 290-7593
Online: paragondfw.com/contact
Related Articles
- We Mapped 301,062 DFW Home Sales. Go Find Your Neighborhood.
- Does One Landlord Own Half Our Street? In Dallas County, Owners With Ten or More Houses Hold 2.5 Percent of Parcels
- Frisco Is Ranked the Number 1 Housing Market in America. Our Sold Data Tells a Different Story.
Sources
- CultureMap Dallas, "Dallas declared one of the top 10 buyer's markets in the U.S. right now," September 18, 2026: https://dallas.culturemap.com/news/real-estate/top-buyers-markets-in-us/ (hook: Redfin ranks the Dallas metro area No. 8 buyer's market).
- Paragon MLS warehouse (NTREIS), single family and townhome closings in the 12-county DFW area, January 1 to July 31, 2022, builder sales and sales without a usable original list price excluded; resales matched on street number, street name, direction, suffix, unit and ZIP through September 30, 2026. Paragon data card for newsletter 0018, `biddingwar.json`.
- Over asking: closing price above the original list price of that listing record. Resold: a later closed sale at the same matched address. Below purchase: later closing price lower than the 2022 closing price, no adjustment for inflation, repairs or fees.
- Selling-cost view: a 6 percent and an 8 percent assumption applied to the resale price; labelled as an assumption, not a measurement.
- Financing: financing type recorded in the MLS for all 28,324 over-asking sales (conventional 65.8 percent, FHA or VA 8.8 percent, cash 24.3 percent; the three shares total 98.9 percent). Loan balances, rates and down payments are not in the MLS.
- Dallas city comparison: the same data restricted to City of Dallas (MLS city field); 585 over-asking resales.
- S&P Cotality Case-Shiller TX-Dallas Home Price Index (series DAXRSA, seasonally adjusted, January 2000 = 100), via Federal Reserve Bank of St. Louis (FRED): https://fred.stlouisfed.org/data/DAXRSA (2007 to 2013 values; the 9.5 percent peak-to-trough drop is our arithmetic).
- Coverage limits: resale detection is a lower bound because off-MLS sales are invisible; addresses and units matched because parcel IDs are not available before September 2023.