Two different building booms are running in this metro at the same time, and they do not look anything alike.
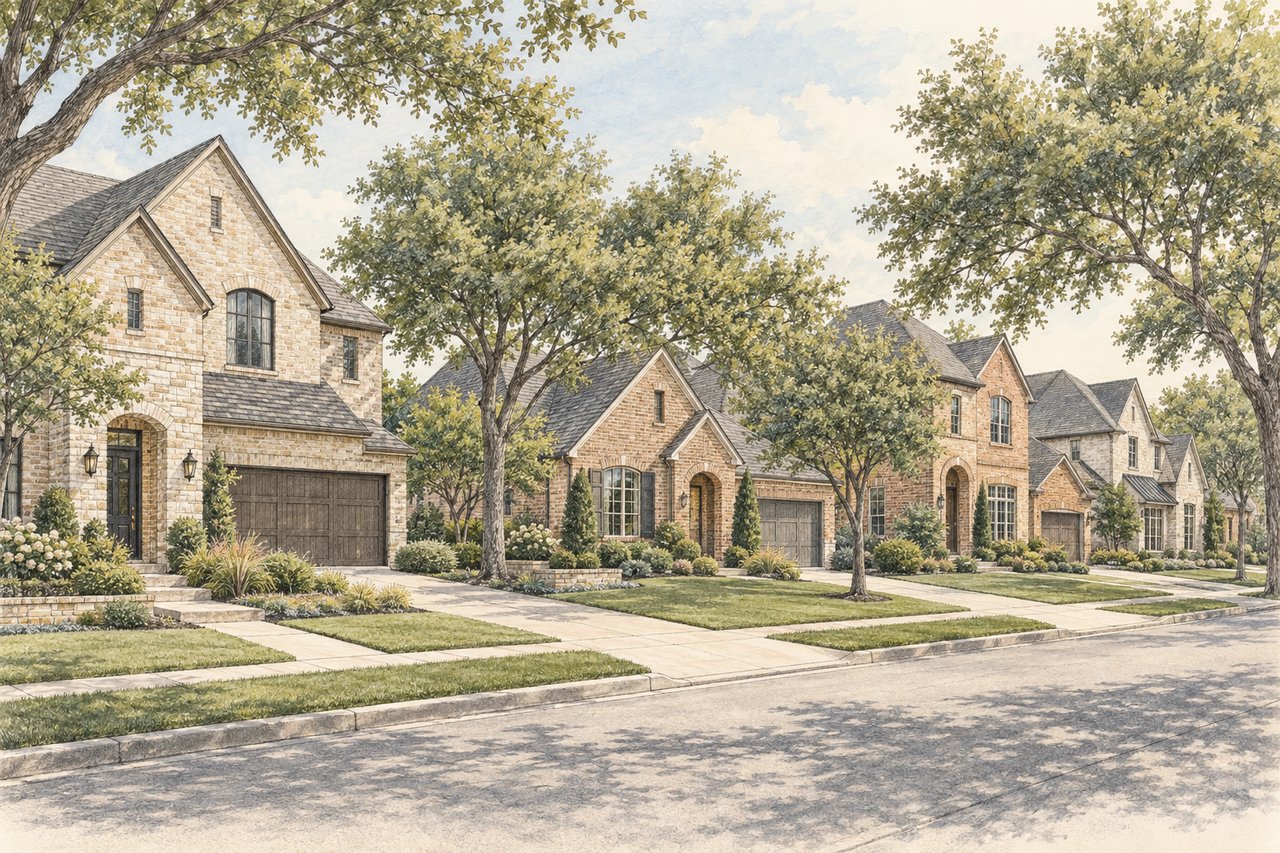
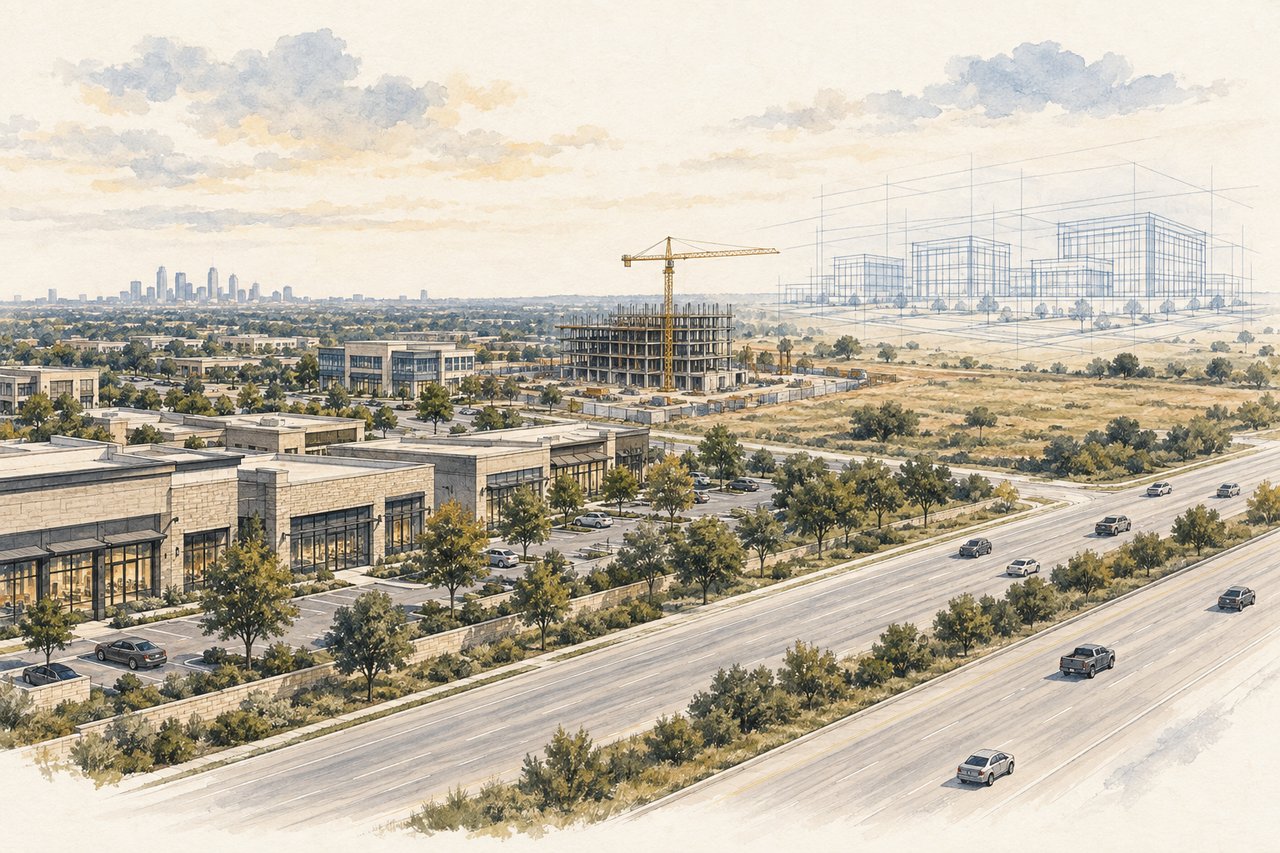
One is on the edge. Celina, Princeton, McKinney, Aubrey and Forney, where in some ZIP codes most of the houses that closed in the twelve months ending September 16, 2026 did not exist two years earlier. That boom is visible from the road. It has model homes, flags and a sales office.
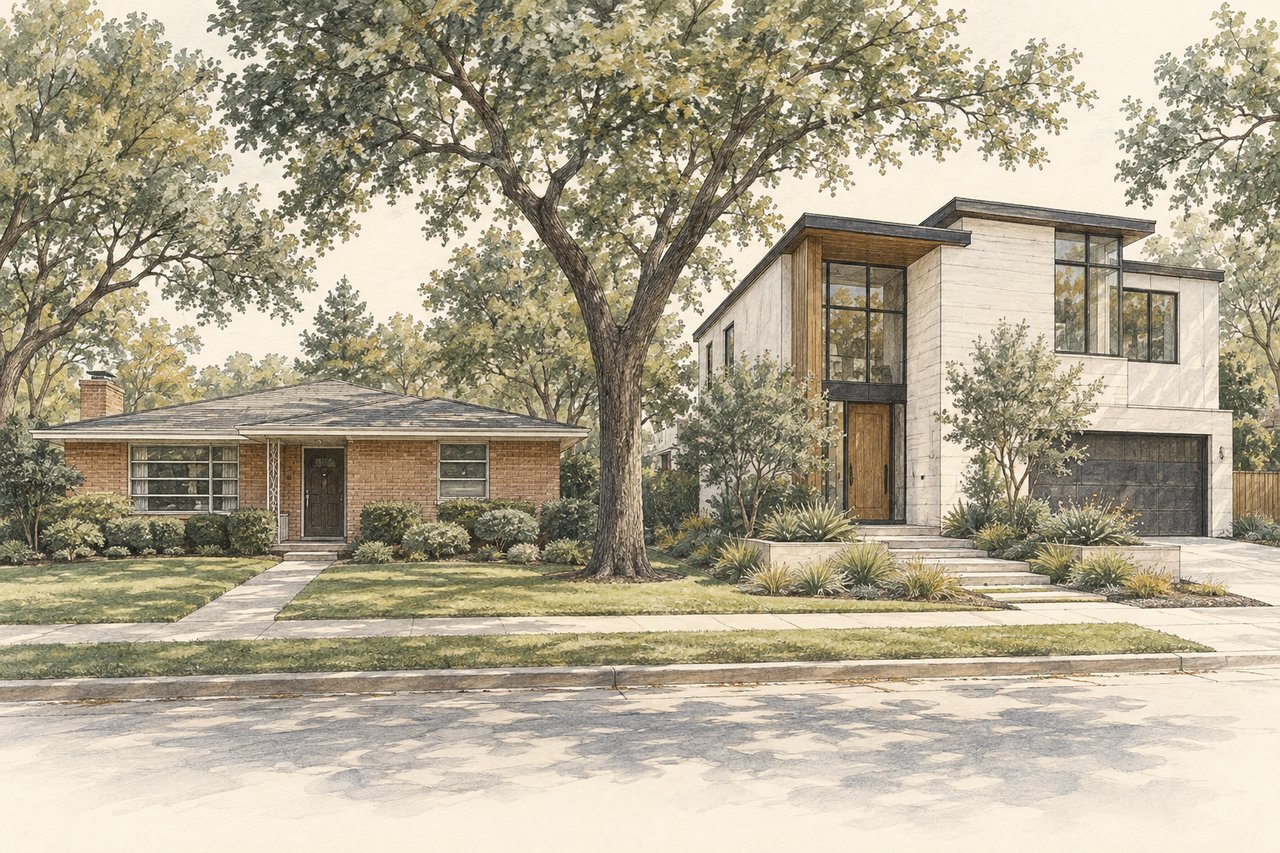
The other is in the middle, one lot at a time. Somebody buys an old house on a good street, the house comes down, and a median of about thirteen months later a newly built house is listed on the same dirt. On the parcels where both the old sale and the new sale closed, that new house sold at a median of 3.48 times what the old one sold for.
We ran both out of the Paragon NTREIS warehouse on September 16, 2026. Every figure in this post comes from that one run, and the method, the definitions and the limits are all stated below rather than left implied. Nothing here is a forecast.
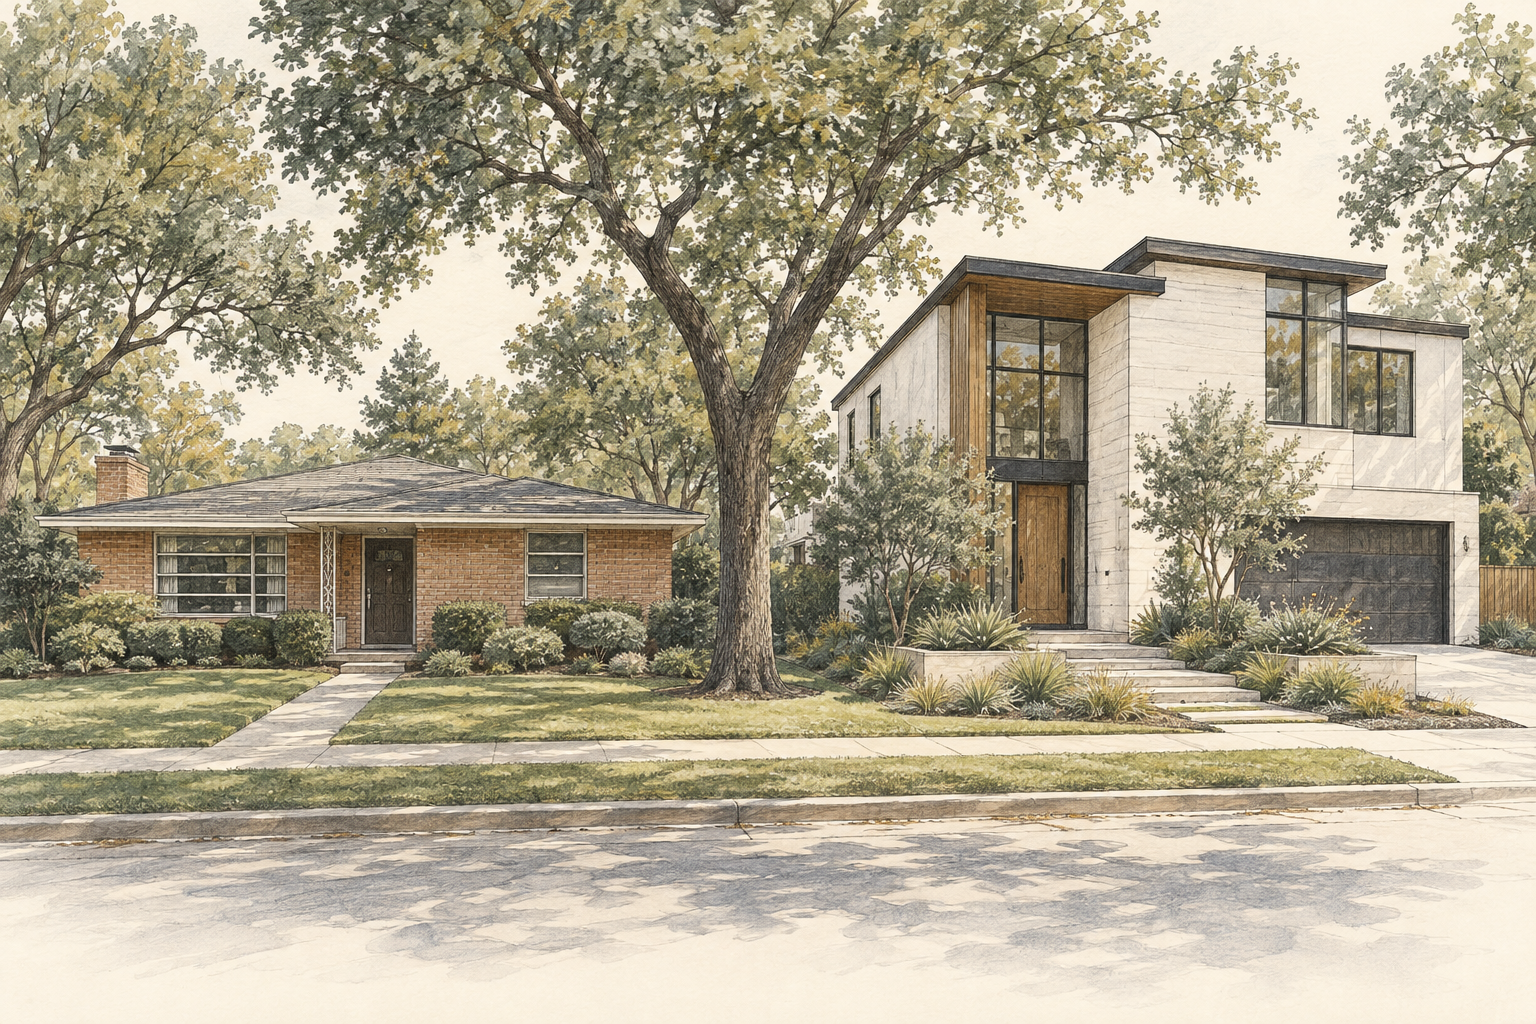
AI-generated editorial illustration of two generations of housing. Not a depiction of specific properties.
Key Takeaways
- The word comp is doing two different jobs in this metro. In a new construction ZIP it usually means a builder's closing. On an older inner lot it can mean a lot sale rather than a house sale.
- New construction was about a quarter of all DFW single family closings in the twelve months ending September 16, 2026, and in a handful of outer ZIP codes it is most of the market rather than part of it.
- We matched 646 parcels metro wide where a house built 1980 or earlier sold and a house built 2022 or later came back on the same lot.
- On the 202 of those parcels where both sides actually closed, the new house sold at a median of 3.48 times the old price. That is a redevelopment multiple, not appreciation.
- The median gap from the old sale to the new listing was 12.8 months, and the teardown count is a floor rather than a census, because transactions completed outside the MLS are excluded, whatever the financing.
How We Defined a New House and a Teardown
Both halves of this post rest on two definitions, so they belong before the numbers.
New construction means a year built of 2025 or later, or an MLS new construction flag. There is no boolean new construction field in this feed. The closest thing is a detail field that carries values like new construction complete and preowned, and it is only populated from mid 2025 forward, so it is usable for the current window and useless historically. Every new construction claim about earlier years therefore rests on the year built alone, which is the more reliable of the two fields.
A teardown rebuild is a matched pair of events on one parcel. The old event is a closed sale of a house with a year built between 1800 and 1980. The new event is the same street number, street name and ZIP code appearing again with a year built of 2022 or later, and a listing or close date after the old sale closed. The first qualifying new event wins and each parcel is counted once.
Scope is closed single family residences only. Condominiums, townhomes, manufactured homes and farm and ranch listings are excluded. A matched pair needs a closed old sale, and the new side may be a listing rather than a close, which is why 646 parcels match on the old sale and only 202 of them have a closed sale on both sides. Every price relationship in this post is published as a median or a ratio, never a mean, and any cell computed on fewer than five observations is suppressed rather than shown.
New Construction Was 25.4 Percent of Closings
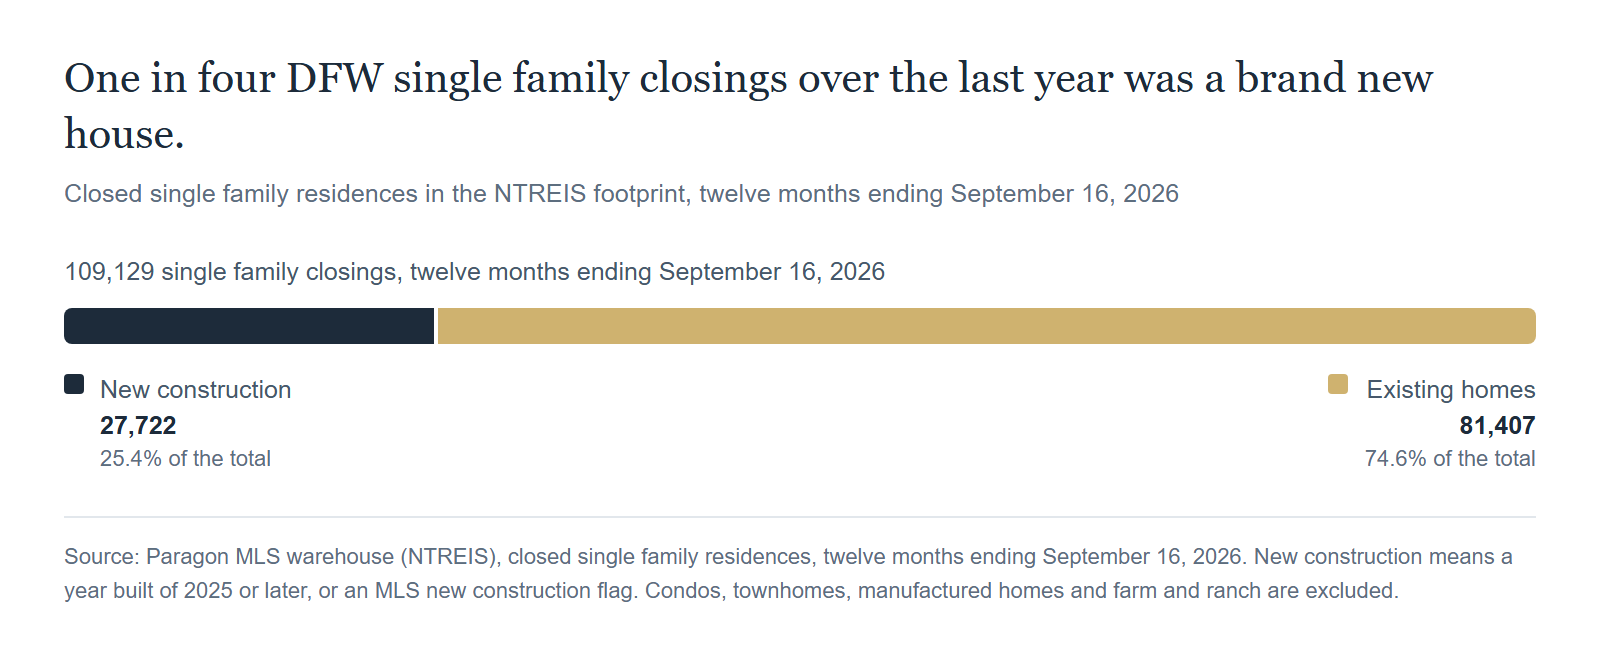
Over the twelve months ending September 16, 2026, 109,129 single family homes closed in the NTREIS footprint. Of those, 27,722 were new construction. That is 25.40 percent. The other 81,407 closings, or 74.60 percent, were existing homes. For 2026 year to date the new construction share is 24.31 percent, on 19,100 of 78,553 closings.
New construction was a quarter of what closed, so a buyer touring resales is also being shown builder product.
The inventory side says the same thing from the other direction. As of September 16, 2026 there are 10,338 active new build single family listings across the metro, against 6,533 new build closings in the trailing ninety days. That works out to 4.7 months of new build supply.
Read that as a builder specific number and nothing more. It counts new listings against new closings, so it is not comparable to a whole market months of supply figure, which uses every listing and every closing. Both of those totals are region wide, before the five observation suppression floor that applies to every ZIP level figure in this post.
Where the Edge Is Being Built
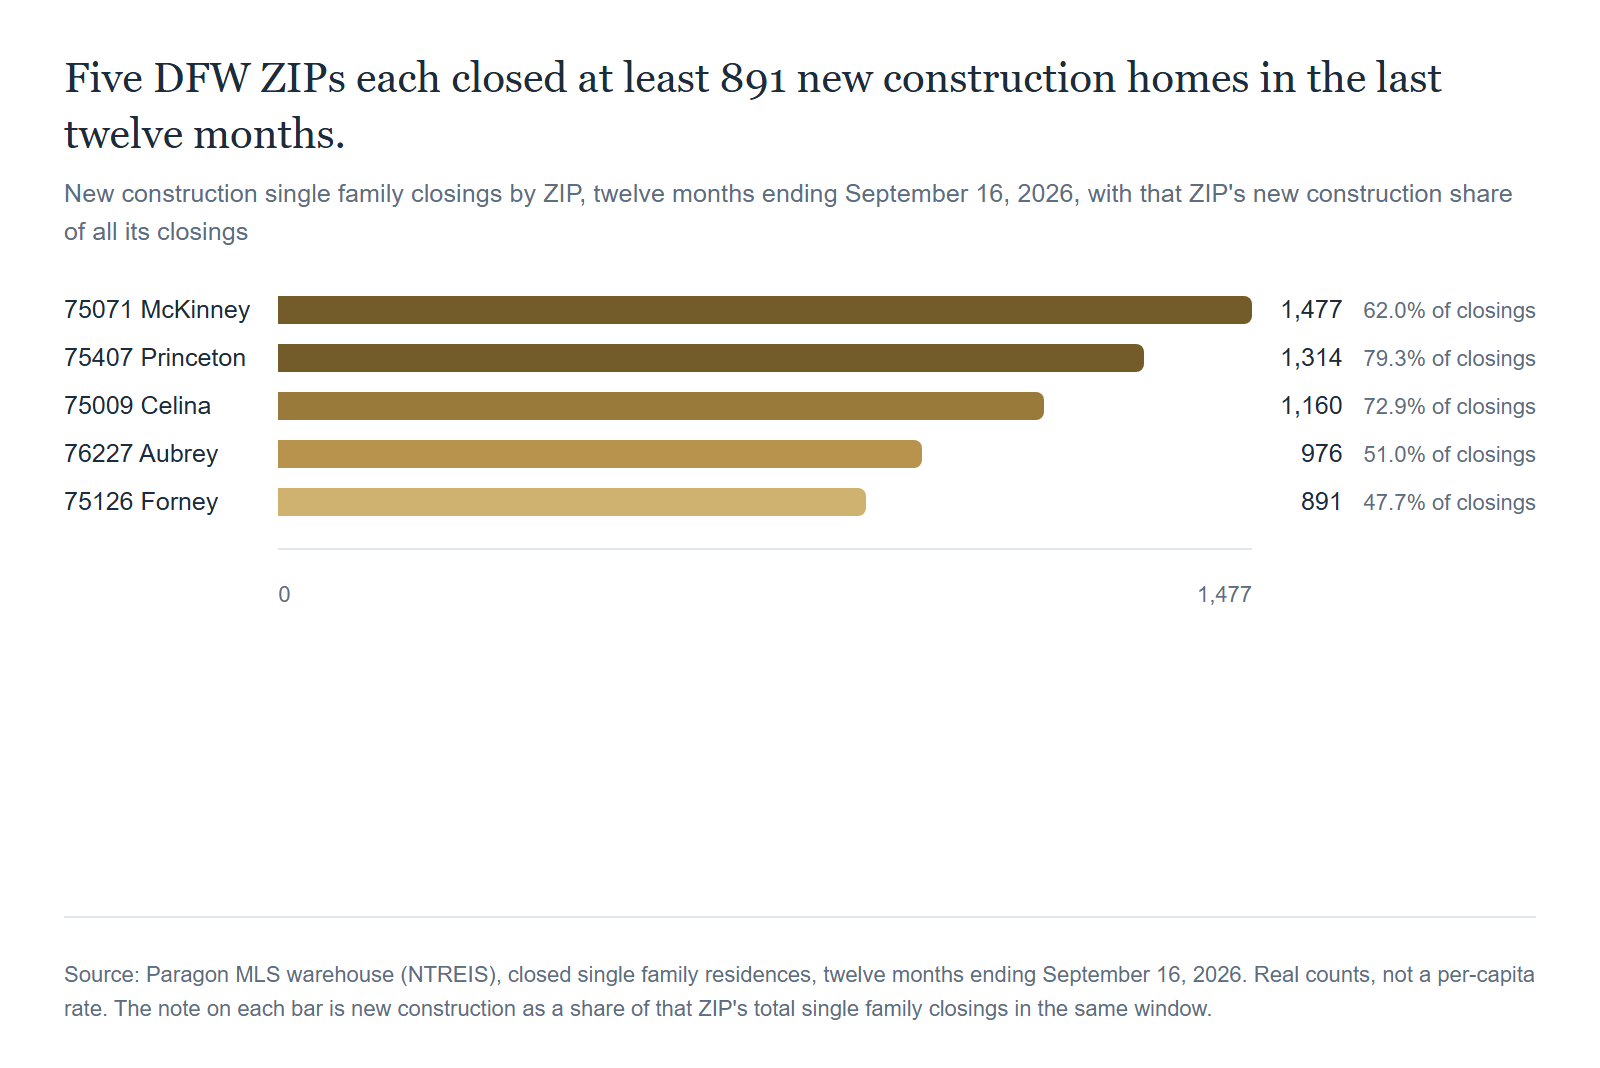
The metro average hides how concentrated this is. Five ZIP codes each closed at least 891 new construction homes in the twelve months ending September 16, 2026, and in several of them new construction is not a segment of the market. It is the market.
In 75407, which covers the Princeton area, 1,314 of the 1,657 single family closings were new construction. That is 79.3 percent. In 75009, Celina, it was 1,160 of 1,591, or 72.9 percent. In 75071, McKinney, 1,477 of 2,381, which is 62.0 percent and the largest new construction count of any ZIP in the metro. In 76227, Aubrey, 976 of 1,915, or 51.0 percent. In 75126, Forney, 891 of 1,868, or 47.7 percent.
Those are real counts rather than rates per thousand households, which matters for a seller. A ZIP where new construction is a high percentage of a small number of sales is a different problem from a ZIP where a builder closed 1,477 houses. In 75071 and 75407, the builder is not background noise in the comparable sales. The builder is the comparable sale.
The appraiser in one of those ZIPs is working from the same closings the builder produced, and so is the buyer who has already walked three model homes.
The Teardown Rebuilds: 646 Matched Parcels
The second pattern is much smaller in count and it lives in the oldest parts of the metro rather than the newest.
We looked for parcels where the MLS shows an old house selling and then a new house coming back at the same address. That search produced 646 matched parcels metro wide. Of those, 177 had their rebuild event in calendar 2025 and 150 in the part of 2026 through September 16. And 535 of the 646 sit inside just 27 ZIP codes, which is what makes this a neighborhood story rather than a metro one.
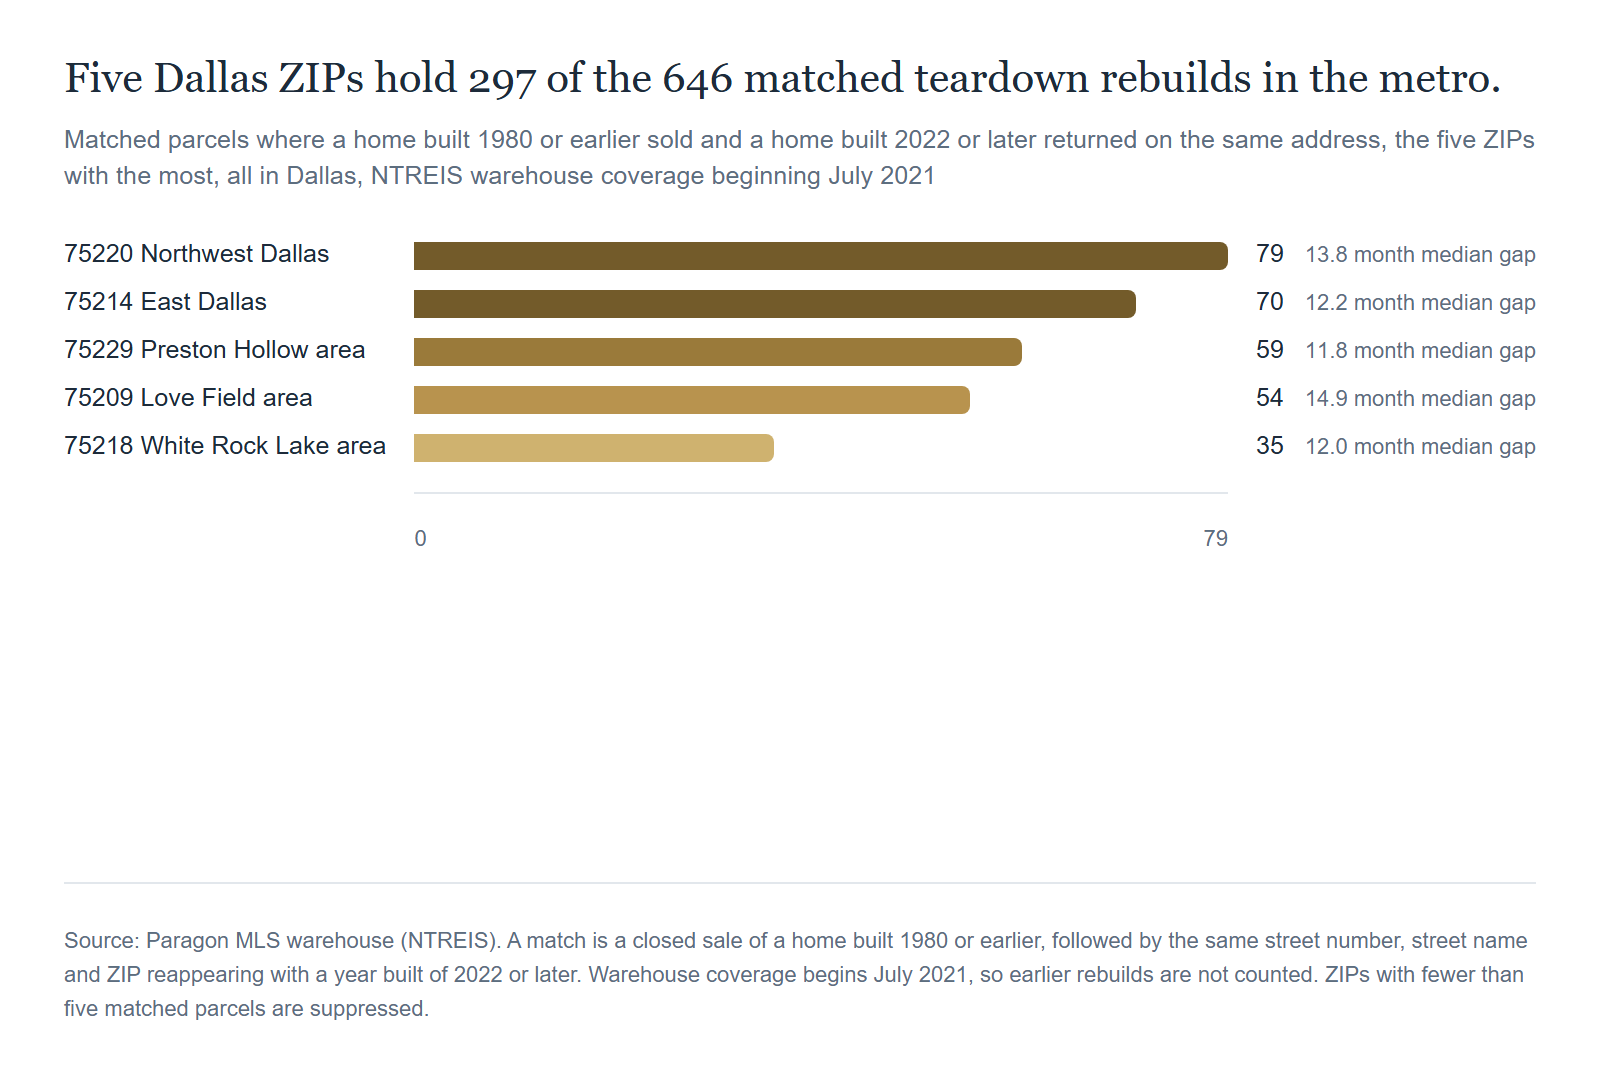
Five ZIP codes carry 297 of the 646. In 75220, northwest Dallas, we matched 79 pairs. In 75214, East Dallas, 70. In 75229, the Preston Hollow area, 59. In 75209, around Love Field, 54. In 75218, near White Rock Lake, 35.
None of those is an edge ZIP. This is the oldest housing stock in the city, sitting on the best located land in the city, and it is being replaced parcel by parcel with a permit rather than a groundbreaking ceremony.
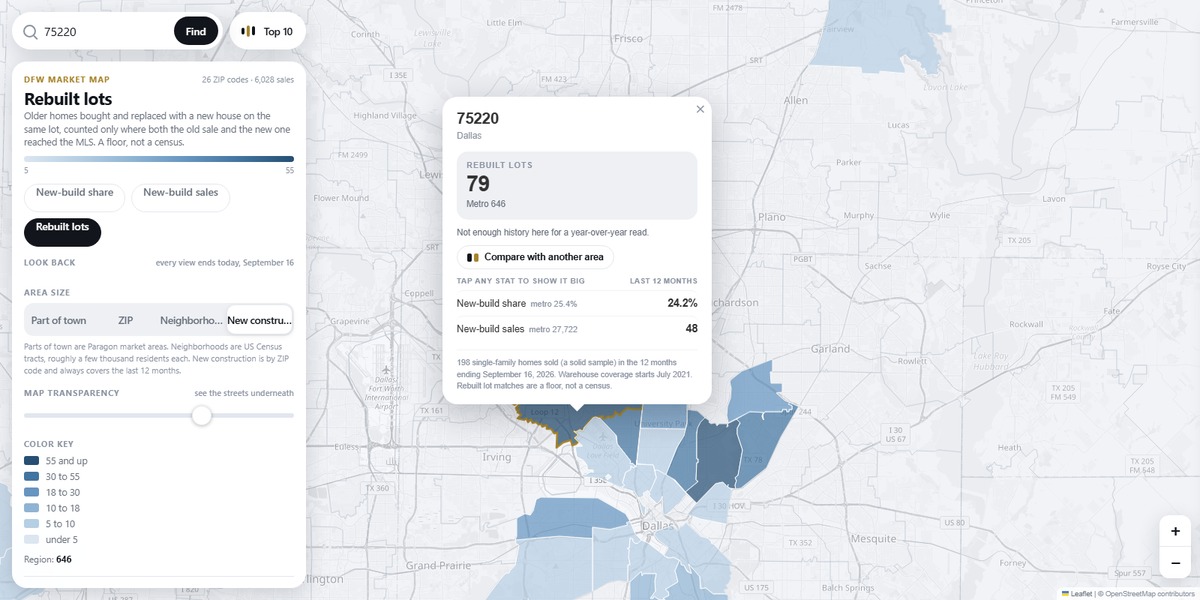
Matched teardown rebuilds concentrated in 75220, northwest Dallas, on the Paragon DFW market map. Source: Paragon market map (NTREIS), zoomed to 75220, ZIP level aggregates only.
The geography inverts the usual story about where construction happens here. On volume, DFW builds on the edge, and 27,722 new construction closings say so. But the highest concentration of rebuild activity we can identify sits in the older parts of Dallas proper, where a buyer is paying for the location and the existing house is the least valuable thing on the site.
What the Lot Was Worth Against What Came Back
On the 202 parcels where both the old sale and the new sale actually closed, the new house sold at a median of 3.48 times the old close price.
Read that number carefully, because it is the one in this post most likely to be misread. It is not appreciation. No house on those lots tripled in value. The ratio compares one sale, an old house bought largely for its dirt, against a later sale of a newly built house on that dirt. It is a redevelopment multiple. What sits between the two numbers is whatever it cost to do the project, which this data does not measure and we do not estimate.
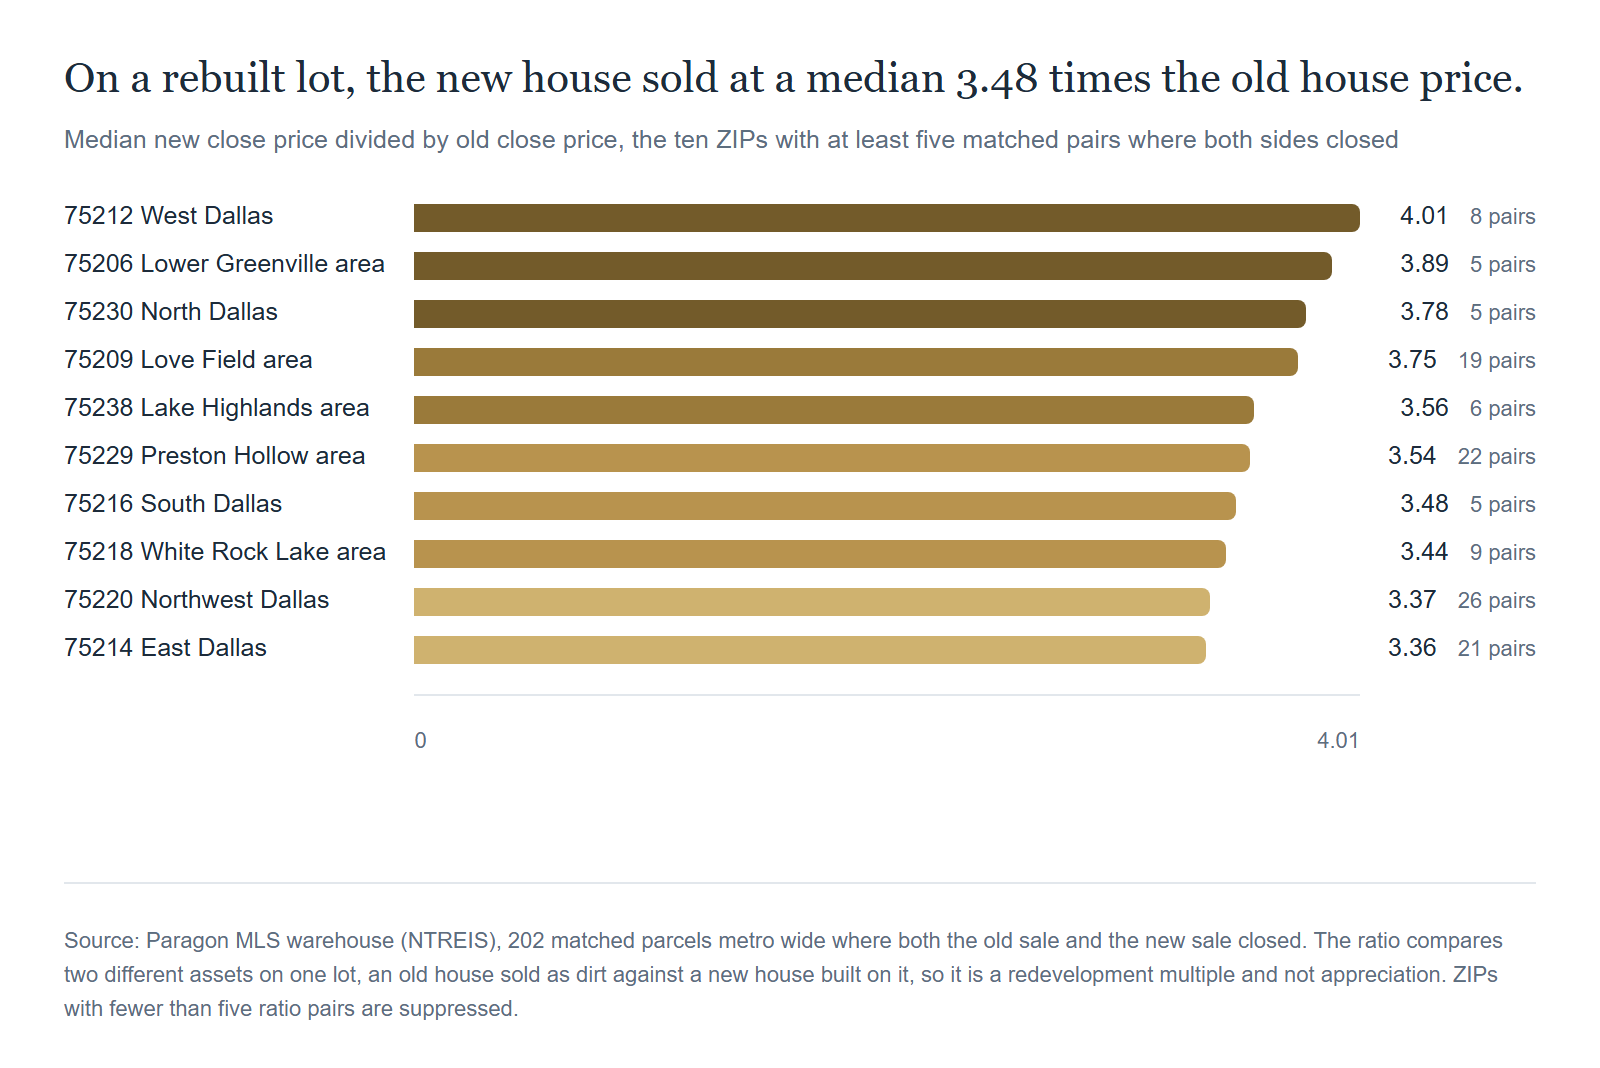
Ten ZIP codes cleared the five pair floor for a ratio, and the range across them is narrower than the concept would suggest. The highest is 75212 in West Dallas at 4.01 on eight pairs. Then 75206 near Lower Greenville at 3.89 on five pairs, 75230 in North Dallas at 3.78 on five, 75209 near Love Field at 3.75 on nineteen, 75238 near Lake Highlands at 3.56 on six, 75229 in the Preston Hollow area at 3.54 on twenty two, 75216 in South Dallas at 3.48 on five, 75218 near White Rock Lake at 3.44 on nine, 75220 in northwest Dallas at 3.37 on twenty six, and 75214 in East Dallas at 3.36 on twenty one.
Every one of those ten sits between 3.36 and 4.01. The metro median across all 202 pairs is 3.48. A band that tight across ten different submarkets is the interesting part, and all it tells us is that the observed ratios cluster. We did not test why.
Two warnings attach to the table. The pair counts are small, from five to twenty six, and a median on five observations is a fragile number that we publish only because the floor is disclosed. And the ratio says nothing about the house next door. We did not measure what a rebuild does to a neighboring property, and this data cannot answer it.
The Gap From the Old Sale to the New Listing
The metro median gap from the old sale to the new listing is 12.8 months. That is measured from the old sale's closing to the day the new house was listed, not to the day the new house closed, so the full cycle is longer than 12.8 months by however long the new house took to sell.
The five highest count ZIPs run close to the metro figure. In 75220 the median gap is 13.8 months, in 75214 it is 12.2, in 75229 it is 11.8, in 75209 it is 14.9, and in 75218 it is 12.0.
If you own a house built 1980 or earlier on a large lot in one of those ZIPs, that gap is the practical planning number, and it cuts in two directions. It is not a construction schedule. It is the elapsed time from the old sale closing to the new listing, which includes whatever the buyer spent on design, permitting, demolition and marketing as well as building, and it tells you the clock somebody else is running when they underwrite your lot. A buyer paying for dirt is pricing a house they will not list for about a year, against a market they cannot see yet.
The Paragon Angle
Our read: the word comp is doing two incompatible jobs in this metro, and most pricing conversations never notice which one is in play.
In a heavy new construction ZIP, the comparable sales are substantially a builder's closings, and in our listing conversations what we see is that a builder's recorded price and a private seller's recorded price are not the same product, because what a builder offers alongside the price does not appear in the recorded number. We did not measure that gap and we do not print a figure for it.
In an older inner ZIP the problem inverts. There are two different values on the same parcel, a house value and a lot value, and they are not the same conversation with the same buyer. A house buyer prices the kitchen, the layout and the roof. A lot buyer prices the setbacks, the frontage, the tree survey and about a year of carry, and will not pay for the kitchen at all. We have watched sellers in these ZIPs list to the wrong buyer, then discover the other number existed the whole time.
The 3.48 figure is the one we expect to be quoted back at us wrong, so we will say it once more. It is not what a house on those streets did. It is what a different house sold for compared to what the old house on the same dirt sold for. A homeowner who reads it as personal equity is reading somebody else's project as their own.
Method and Limits, If You Want Them
- Source is the Paragon NTREIS warehouse, read on September 16, 2026, and refreshed nightly, so it can be up to about a day stale. Scope is closed single family residences only. Condominiums, townhomes, manufactured homes and farm and ranch are excluded.
- The twelve month window is September 17, 2025 through September 16, 2026. The 2026 year to date window is January 1, 2026 through September 16, 2026, which is a partial month at the end. Months of supply uses the trailing ninety days, June 18, 2026 through September 16, 2026.
- New construction is defined as a year built of 2025 or later, or an MLS new construction flag. That flag is populated only from mid 2025 forward, so historical claims rest on the year built alone. A builder reselling an older spec home is deliberately not counted as new construction.
- The teardown match uses street number, street name and ZIP. Only about 27 percent of warehouse rows carry a parcel number, so a parcel number cannot be the primary key. A lot split into two houses, a renumbered address, or a street name spelling change all break the match, which undercounts.
- The 646 is a floor, not a census. It counts only parcels where both the old sale and the rebuild touched the MLS, and warehouse coverage begins in July 2021, so a rebuild whose old sale predates that is invisible. Transactions completed outside the MLS are excluded whatever the financing, so builder land assemblies and off market teardowns are invisible for the same reason. Real teardown activity in DFW is certainly higher than 646.
- Everything is published at ZIP code level. No address appears anywhere in this post or in the underlying files, and the teardown price relationship is published only as a ratio.
- Any figure computed on fewer than five observations is suppressed. It is never shown as a zero and never estimated.
- New build months of supply is new actives over new closings, so it is not comparable to whole market months of supply.
- The year to date window is about 8.5 months and the twelve month window is twelve months. Compare shares between them, never counts.
- A ZIP code is not a neighborhood. Several of the ZIPs named here straddle more than one submarket.
One footnote governs every price figure on this page: a median sale price describes what sold in that ZIP, not the same house revalued. When a ZIP's median moves, the mix of homes that closed moved. It is not a statement about your house.
Frequently Asked Questions
Is a quarter of DFW really brand new?
A quarter of the single family homes that closed in the twelve months ending September 16, 2026 were new construction, at 25.40 percent. That is a share of sales, not a share of the housing stock. Existing homes turn over slowly and new ones all sell at once, so new construction is always overrepresented in closings.
Which DFW ZIP codes have the most teardowns?
Of the 27 ZIPs that cleared our five pair reporting floor, the five with the most matched rebuilds are 75220, 75214, 75229, 75209 and 75218. All five are inside Dallas. Those five carry 297 of the 646 matched parcels metro wide.
Does a teardown next door raise my home value?
We did not measure that, and this data cannot answer it. What we can describe is what we matched: on these parcels an old house sold, a new house was built, and where both sides closed the new one sold at a median of 3.48 times the old price. What that does to the house next door is a separate question we did not test.
Why is the 3.48 multiple so large?
Because the two sides are different products. The old side is an older house being bought largely for its lot. The new side is a newly built house. The ratio is a comparison between those two sales and not appreciation on anyone's property.
How long does a teardown rebuild take?
The median gap from the old sale closing to the new house being listed is 12.8 months metro wide, and 11.8 to 14.9 months across the five highest count ZIPs. The full cycle is longer, because that measurement stops at the new listing rather than the new closing.
Conclusion: Two Different Markets in One MLS
A quarter of this market is brand new. In the outer ZIP codes that is not a segment, it is most of what sells, and in 75407 it was 79.3 percent of closings in the twelve months ending September 16, 2026.
In the older inner ZIPs a slower version of the same thing is running. Lots trade, houses come down, and a median of about thirteen months after the old sale closed a new house is listed on the same dirt. On the 202 parcels where both sides closed, that new house sold at a median of 3.48 times the old price, and the honest reading of that number is a comparison of two different sales on one lot, not appreciation.
Those are two different markets, with two different buyers, sharing one MLS and one set of comparable sales. The reason to know which one your house is sitting in is that they price differently and they take different lengths of time.
If your house was built 1980 or earlier on a large lot in the older Dallas ZIPs named above, there may be two numbers on your parcel. If your house is a resale in a ZIP where builders closed more than a thousand houses in the twelve months ending September 16, 2026, your competition is largely builder product. Neither of those is visible from a listing price alone.
Talk to Paragon
We pull this warehouse for clients before a listing conversation, not after. If you want to know which of these two markets your house is actually in, and what your lot is worth separately from your house, we are glad to run it.
Email: [email protected]
Phone: (469) 290-7593
Online: paragondfw.com/contact
Related Articles
- We Mapped 301,062 DFW Home Sales. Go Find Your Neighborhood.
- We Fact-Checked Every Over-Asking Sale in DFW. Concessions Knock Nearly 4 in 10 Back to Asking or Below.
- Frisco Is Ranked the Number 1 Housing Market in America. Our Sold Data Tells a Different Story.
- The Appraisal Escalator: Dallas Is About to Cut Your Tax Rate for an 11th Year
Sources
- Paragon MLS warehouse (NTREIS), closed single family residences, read September 16, 2026. All closing counts, shares, active inventory, matched teardown pairs, median gaps and median ratios in this post come from that one run.
- Paragon Realty Advisors data card, "Newsletter 0017, story two: Where Dallas is being rebuilt," September 16, 2026, which states the definitions, the query row counts, the suppression rules and the caveats reproduced above.
- Paragon builder script `newbuild_teardown_stats.py`, run September 16, 2026, read only against the local warehouse with no network call and no paid service.
- Paragon ZIP level output file `zip_newbuild.csv`, September 16, 2026, for every ZIP new construction count and share quoted here.
- Paragon ZIP level output file `zip_teardown.csv`, September 16, 2026, for every matched pair count, median gap and median price ratio quoted here.
- Paragon market map (NTREIS), ZIP level aggregates, for the 75220 screenshot.
- MLS warehouse access and scope rules, `MLS_DB_ACCESS.md`, for the single family scope predicate and the exclusion of lease records, whose close price is a monthly rent.
- Texas is a non-disclosure state, so these figures come from the MLS warehouse rather than from public sale price records, which is stated here so the reader knows the population being described is closings reported to NTREIS.